
Your Company's Real Risk, Not the Industry Average
What if your insurance program actually accelerated growth instead of just limiting downside?
Built for How Business Actually Works
From your financials to your optimal coverage structure in four steps.
One Company. Yours.
Build your risk management strategy on what actually matters: your company's own growth trajectory over time, not industry-wide averages that mask the risks unique to your business.

Advanced Analytics
Model thousands of potential futures for your business to identify which risks genuinely threaten your growth and which ones can be safely retained.
Optimal Insurance Design
Identify the appropriate deductibles, limits, and layers for your business, ensuring they are structured to maximize long-term value rather than simply minimizing this year's premium.

Measurable Impact
Know whether your coverage strategy is working with clear reporting, historical validation, and alerts when business conditions change.


A loss that's “manageable on average” can end your company in practice
Traditional risk models average across hundreds of companies. But your company doesn't get hundreds of tries. You get one shot, playing out year after year. A loss that looks small “on average” can compound into a crisis for a single business.

Why Averages Are Misleading
Your industry's average loss ratio might be 60%. But if your worst year wipes out three years of profit, that average means nothing. Traditional models can't see this danger because they blur your company into the crowd.

A simulation engine built around one company: yours
Most simulation tools assume your company bounces back from every loss. In reality, some losses permanently shrink what your business can do next. Mostly Optimal models that reality so your insurance strategy protects the growth you've already built.
What Changes When You Model Your Company, Not the Market

Your Unique Journey, Not the Industry Average
Industry benchmarks tell you what happens to the average company. We simulate what happens to yours (year by year, decision by decision) so you can see risks and opportunities your current analysis can't.

From Cost Center to Catalyst
See exactly how the right coverage levels accelerate your growth, not just transfer your risk. Find the structures that maximize long-term value while guarding against the losses that could end the game.

Built for Your Business
Every analysis begins with your actual financials, operations, and risk tolerance. Design coverage that suits both you and your carrier based on how your business really functions, rather than relying on textbook assumptions.
What's Under the Hood
Long-Term Business Optimization
Advanced optimization algorithms that maximize long-term company value through optimal insurance decisions, based on your company's actual trajectory rather than industry-wide averages.
Comprehensive Financial Statements
Familiar financial reporting formats directly from risk analysis outputs (Balance Sheet, Income Statement, Cash Flow).
Multi-Layer Insurance Tower Design
Sophisticated insurance program structuring with support for multiple layers, attachment points, reinstatements, and aggregate limits.
Advanced Risk Metrics Suite
Quantify your worst-case exposures with industry-standard risk metrics so you can make coverage decisions backed by hard numbers, not gut feel.
Monte Carlo Simulation Engine
Run thousands of scenarios to see the full range of what could happen to your business, from best case to worst case and everything in between.
Scenario Management & Sensitivity Analysis
Ask "what if?" at scale. Test how your strategy performs across different loss patterns, market conditions, and business assumptions.
Strategy Backtesting & Walk‑Forward Validation
Test your strategy against history. See how today's approach would have performed in past years and stress-test it against future scenarios.
Real-Time Business Constraints
Analysis that respects your real business constraints, including risk tolerance, return targets, leverage limits, and liquidity needs.
Executive Reporting & Visualization
Interactive dashboards and board-ready reports that make the analysis easy to share, defend, and act on. Export to Excel when you need to.
See It in Action
Click any chart to explore interactively
Find the deductible that balances cost and risk
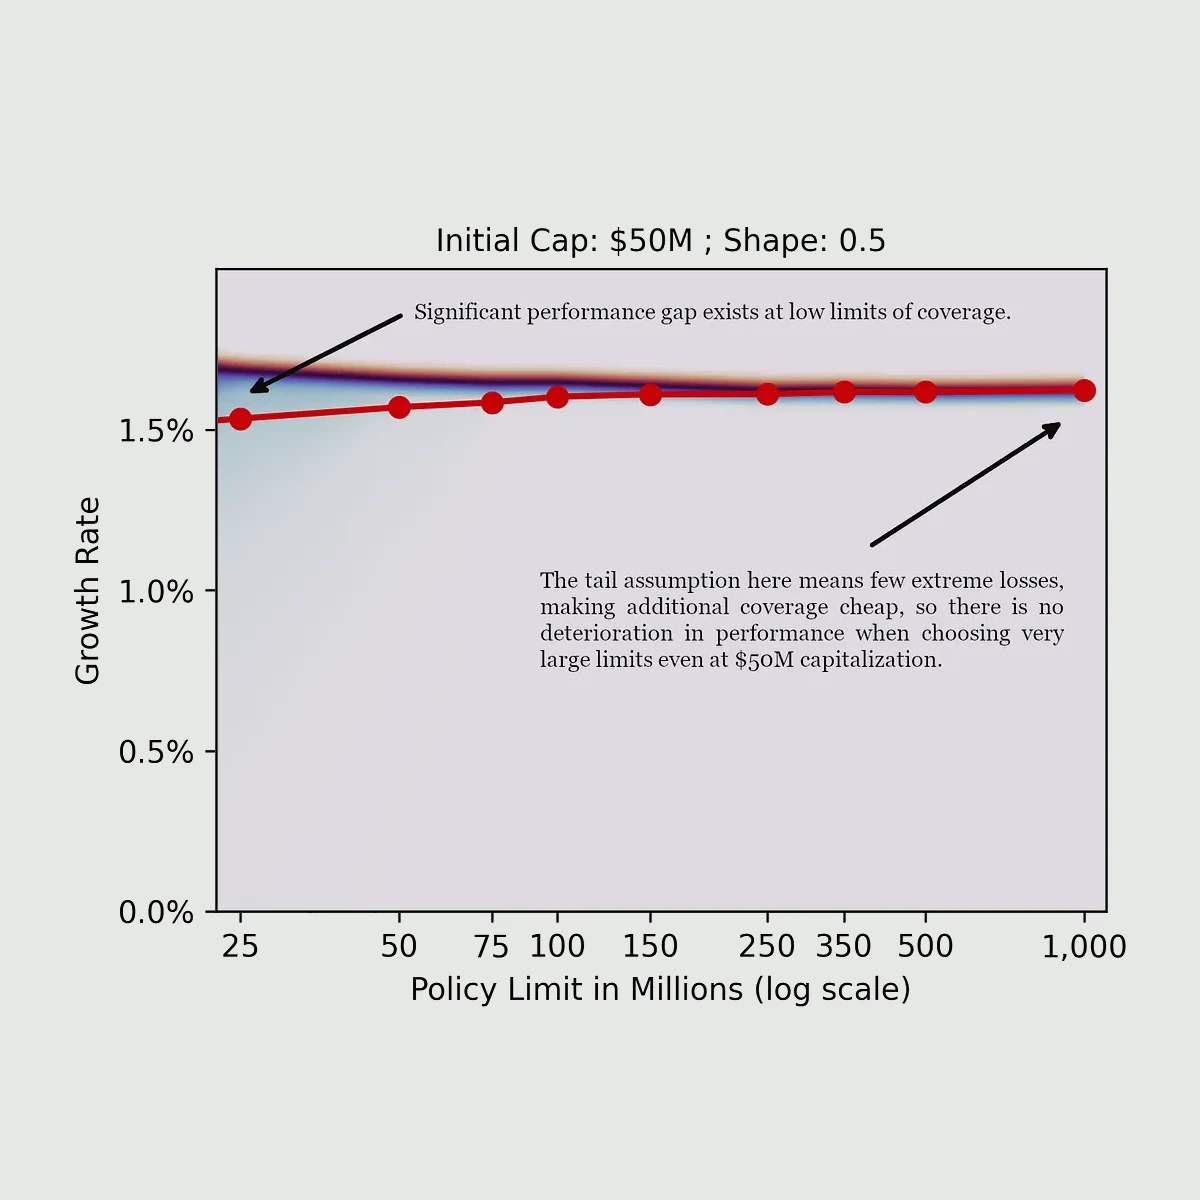
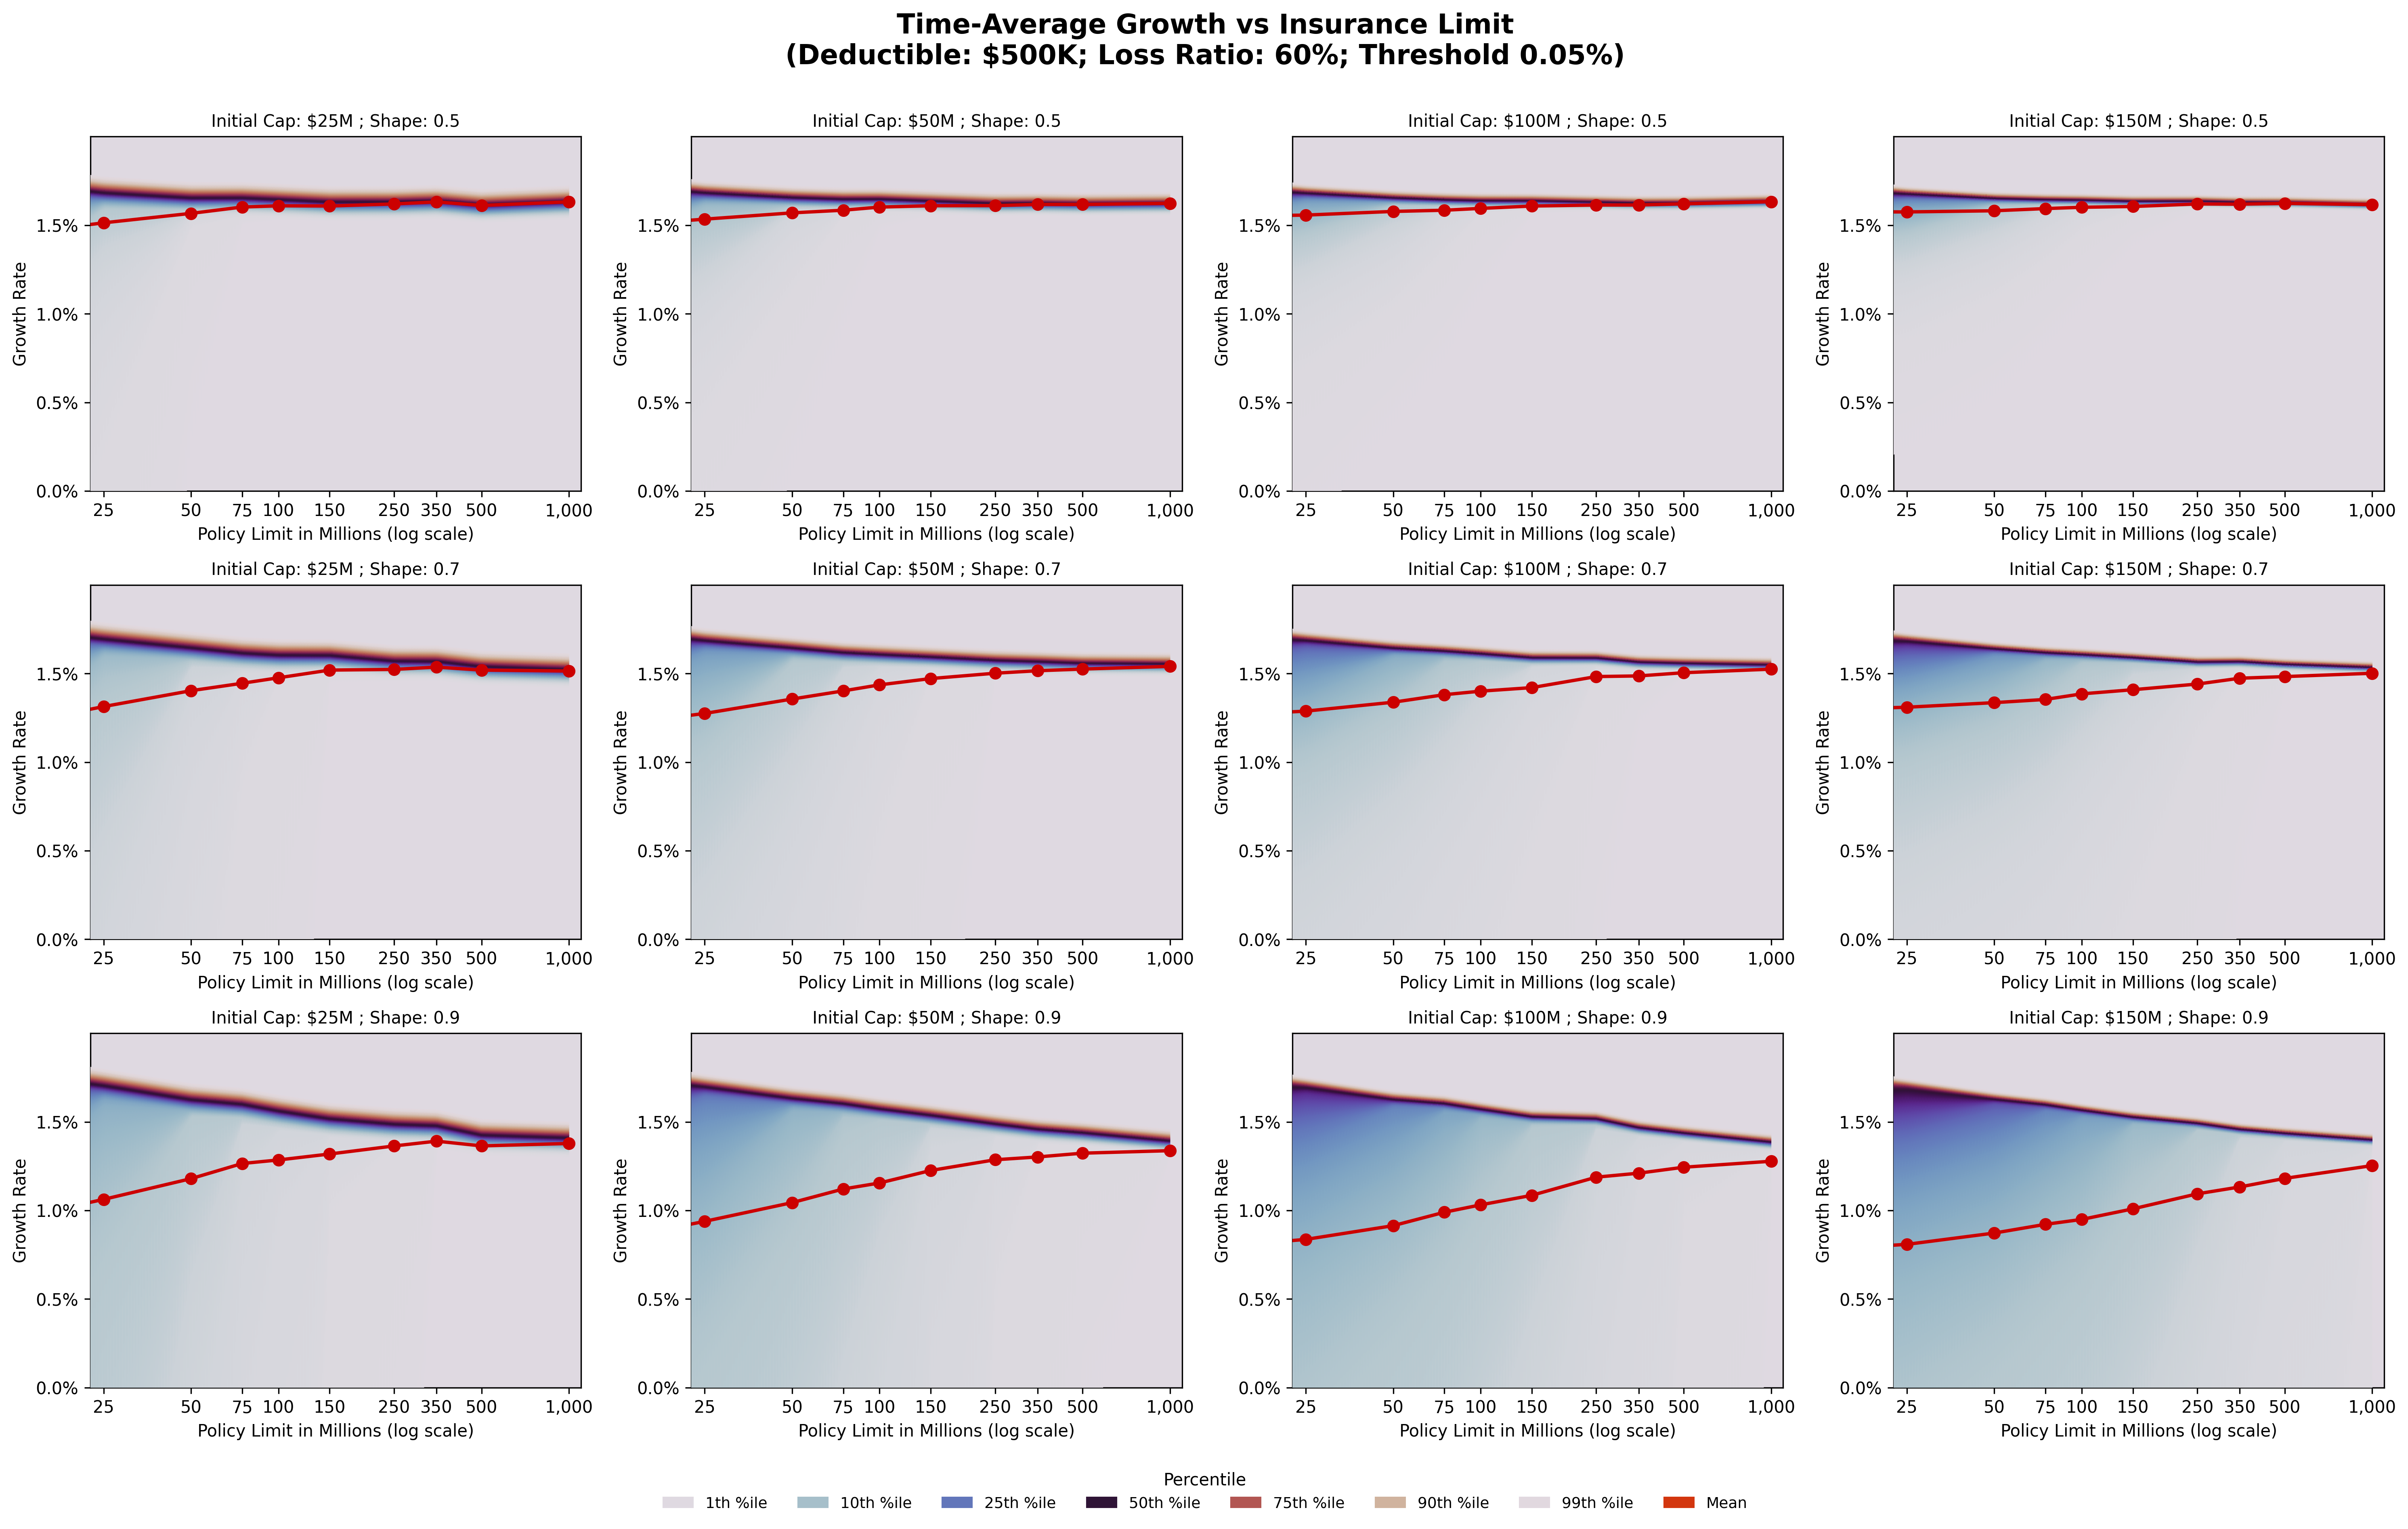
Find the limit that protects your company without overpaying
Explore which variables matter most for your coverage strategy
Identify strategies that hold up even when loss patterns shift

Ready to Run Your Own Analysis?
Assess your current insurance structure and discover how an optimized program can impact your bottom line.
Open source, no sales pitch. Just superior analysis.